Debtors - Graph (Reports menu)
The Graph - Debtors per week displays the debit and credit transaction totals of all debtor (customer / client) accounts per week in a bar chart.
To print a Graph - Debtors per week:
1.Select the Reports → Debtors → Graph menu.
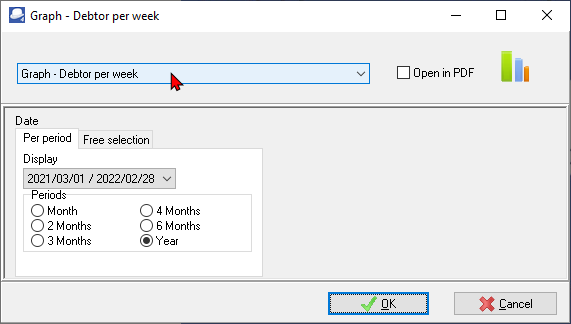
2.Select the Period - Select a period on the Per period tab. You may click on the Free selection tab to select a specific date or a range of dates to include in the graph.
3.Click on the OK button.
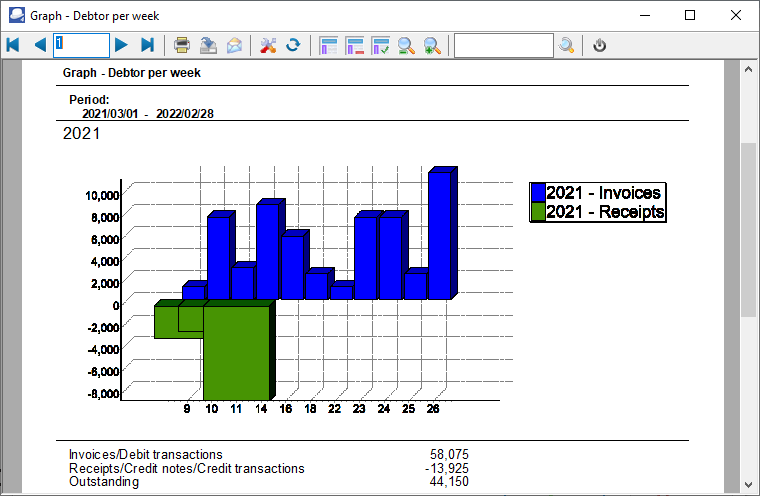
An example of the "Graph - Debtor per week", is as follows:
|
|
The Outstanding amount should balance with the Debtor's control account on all reports, if the same periods are selected. |

The details are as follows:
1.Vertical Axis -
a)Positive amounts - Invoices and debit batch transactions (e.g. take on opening balances, adjustments, refunds (payments to debtors), Generate multiple transactions (i.e. Interest on overdue debtor (customer / client) accounts, fixed amounts to all debtors and charge amounts), etc. per week.
b)Negative amounts - Credit notes, receipts (payments received from debtors) and other credit transactions (e.g. adjustments, bad debts written off, Multiple Transactions (i.e. Balance Debtors with amount less than a specified amount), etc. per week.
2.Horizontal Axis - This is the Number of the Week in the calendar year (1 to 52).
3.Totals
a)Invoices/Debit transactions - The total amount value of debit transactions for the entire period.
b)Receipts/Credit notes/Credit transactions - The total amount value of credit transactions for the entire period.
c)Outstanding - This is the difference (movement) of the debit and credit transactions. A positive figure indicates that there are more Invoices and debit transactions than credit notes, receipts and credit transactions for the period.