The Graph - Vendors per week displays the debit and credit transaction totals of all vendor accounts per week in a bar chart.
To print a Graph - Vendors per week:
1.On the Reports ribbon, select Reports → Vendors → Graph.
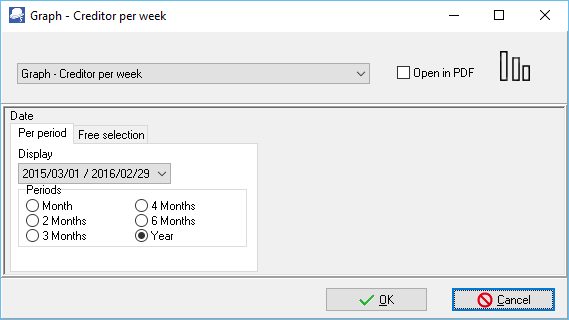
2.Select the Period - Select a period on the Per period tab. You may click on the Free selection tab to select a specific date or a range of dates to include in the graph.
3.Click on the OK button.
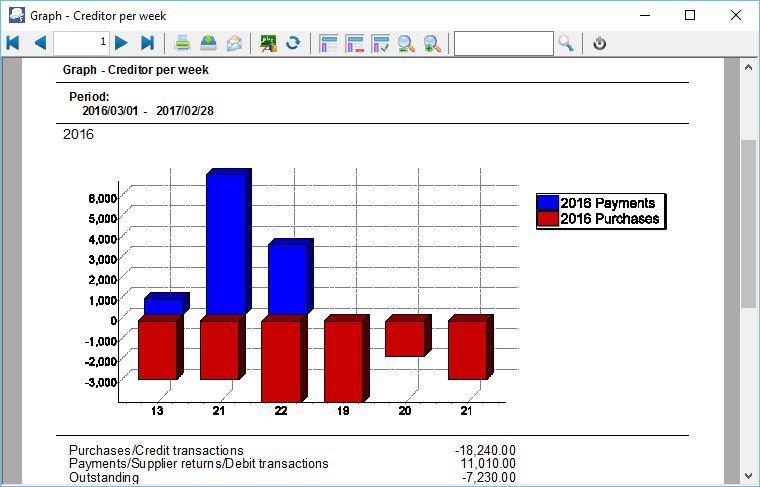
An example of the Graph - Vendors per week, is as follows:
|
The Outstanding amount should balance with the Vendor's control account on all reports, if the same periods are selected. |
The details are as follows:
1.Vertical Axis -
a)Negative amounts - Purchase documents and credit journal transactions (e.g. take on opening balances, adjustments, refunds (payments received from vendors), Generate multiple transactions (i.e. Vendors with charge amount), etc. per week.
b)Positive amounts - Supplier returns, payments and other debit transactions (e.g. adjustments, etc. per week).
2.Horizontal Axis - This is the Number of the Week in the calendar year (1 to 52).
3.Totals
a)Purchases/Credit Transactions - The total amount value of Purchase documents and credit transactions for the entire period.
b)Payments/Supplier returns/Debit Transactions - The total amount value of Supplier return documents and debit transactions for the entire period.
c)Outstanding - This is the difference (movement) of the debit and credit transactions. A negative figure indicates that there are more Purchases and credit transactions than Supplier returns, payments and debit transactions for the period.
Created with the Personal Edition of HelpNDoc: Free help authoring environment
